
RSI Indicator: How to Read It and Trade It on Crypto Futures
What the Relative Strength Index measures, why 70 and 30 fail in a trend, and how to trade RSI divergence, shown on real BTCUSDT charts.

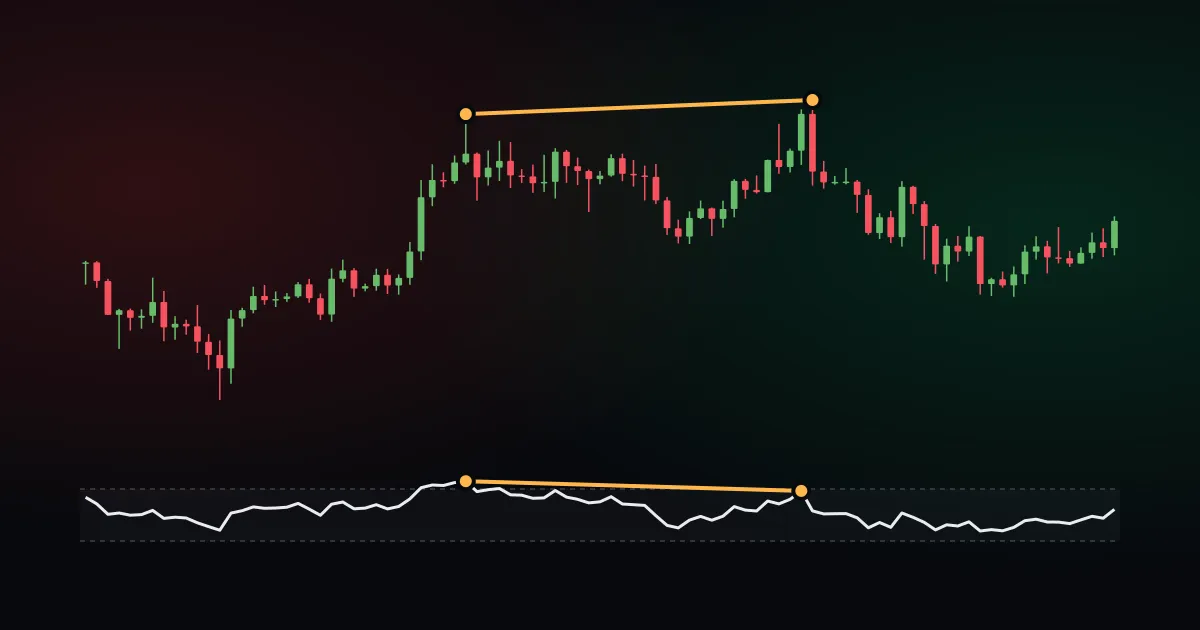
The Relative Strength Index (RSI) is the most widely used momentum indicator in crypto, and probably the one responsible for the most liquidated accounts. Most beginners learn a dangerously simple rule: sell above 70, buy below 30.
On a crypto futures chart during a bull run, shorting an asset just because the RSI hit 70 is a guaranteed way to get your stop hunted or your account wiped out in a single trend.
This guide covers what RSI actually measures, why the textbook levels fail, and how to read divergence: the real signal experienced traders use RSI for. Every chart below is real BTCUSDT perpetual data from Binance, and the RSI on each one is computed with the exact same low-latency engine we use inside the Awansi terminal.
What RSI Actually Measures
Introduced by J. Welles Wilder in 1978, RSI compares how much price closed up versus how much it closed down over a recent window (usually 14 candles), scaling the result from 0 to 100:
RS  = average gain / average loss    (over the last 14 closes)
RSI = 100 - 100 / (1 + RS)
The math relies on a smoothing technique, making it a running figure. But reading it is much simpler than calculating it:
- Above 50: The average up close has been bigger than the average down close. Buyers are in control.
- Below 50: Sellers are dominating.
- The further from 50: The more aggressive and one-sided the recent price action has been.
Crucial detail: RSI says nothing about whether a coin is “cheap” or “expensive.” It only measures how fast and how consistently the price has been moving in one direction.
The “70 and 30” Liquidation Trap
Wilder drew lines at 70 and 30, calling them “overbought” and “oversold.” In crypto, these names are a massive trap. “Overbought” sounds like the price is about to dump. In reality, it just means recent closes have been aggressively green, which is exactly what a massive breakout looks like.
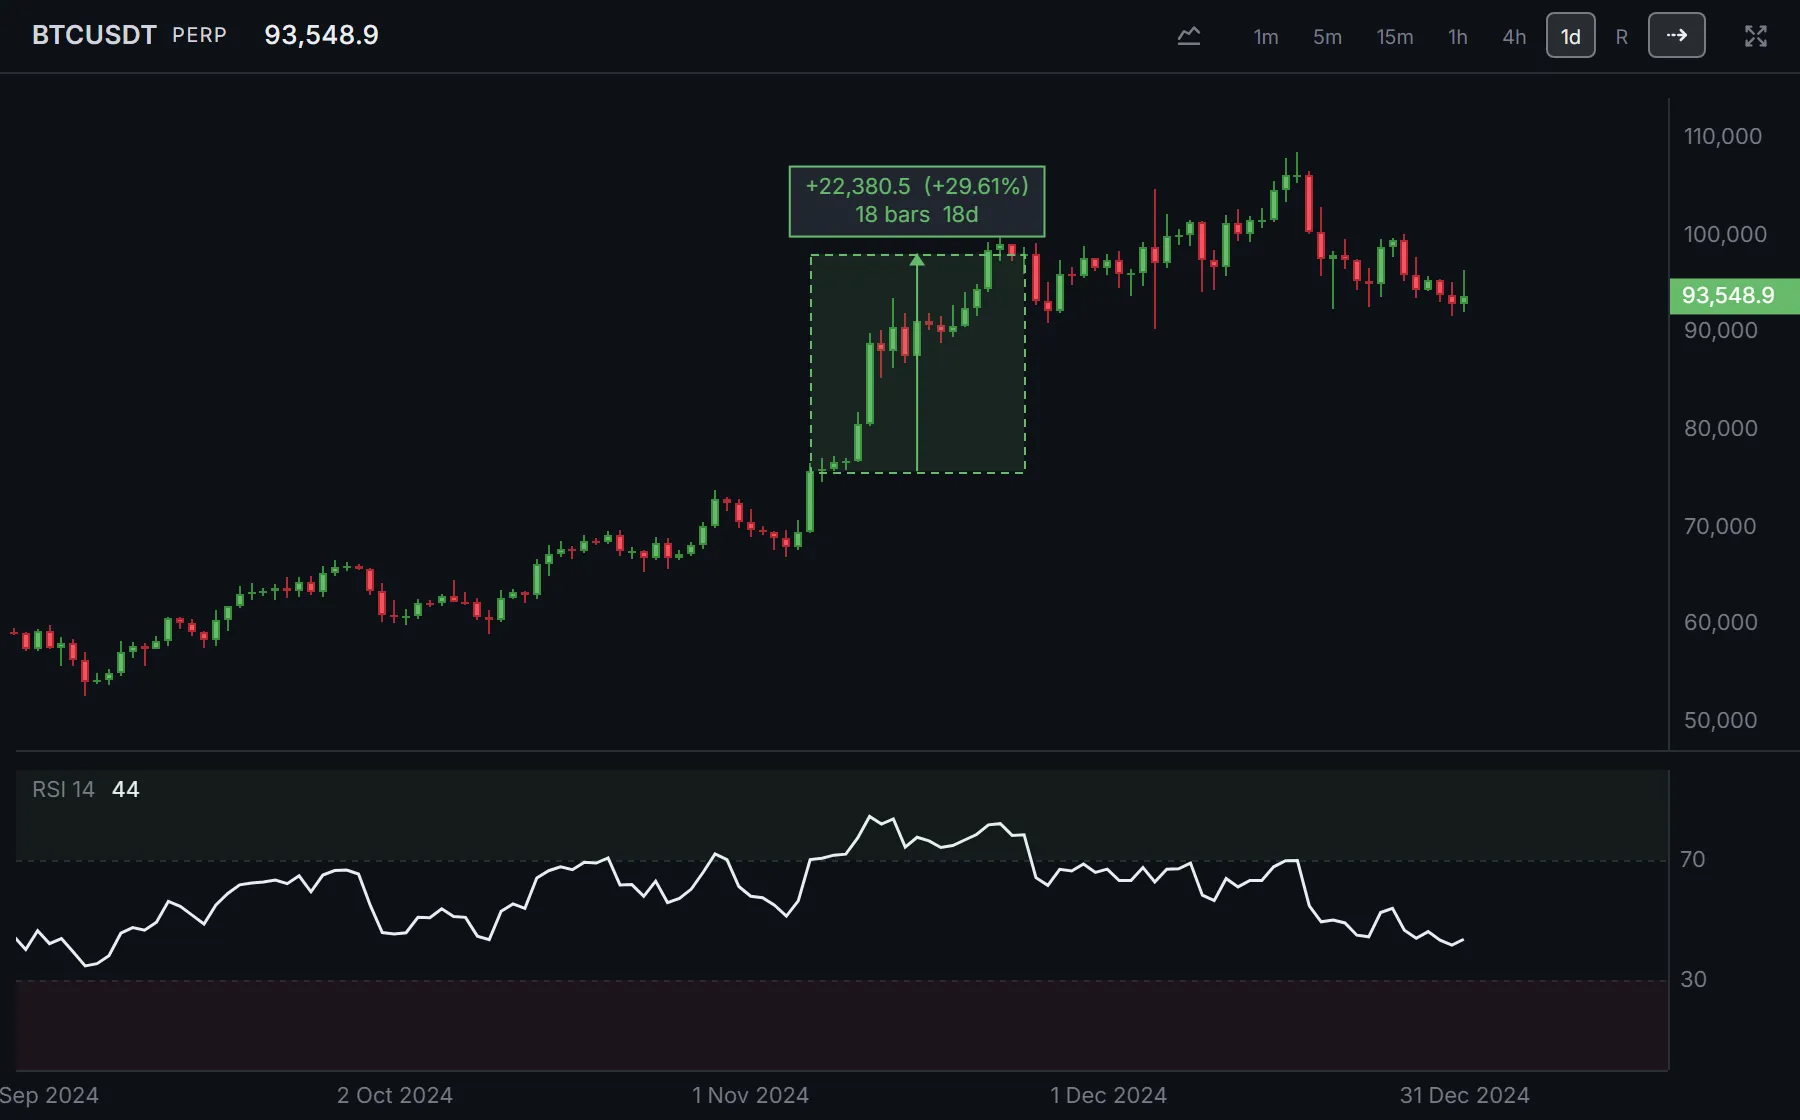
Look at November 2024. Daily RSI on BTCUSDT crossed above 70 on November 6, with the close at $75,580. It then stayed “overbought” for 19 days in a row. By November 24, the price was $97,960, a 29.6% increase. If you opened a short at 5x leverage just because RSI hit 70, you would have been completely liquidated.
Two rules of thumb make these levels useful instead of dangerous:
- Treat extreme readings as a description, not a trigger. RSI above 70 says the trend is incredibly strong. Do not step in front of a freight train.
- Watch where RSI holds on pullbacks. In a healthy uptrend, RSI often dips to the 40 to 50 zone and bounces without ever touching 30. A pullback that holds the 40s is a much better long signal than trying to catch a falling knife at 30.
The Real Alpha: RSI Divergence
Divergence is where RSI actually earns its place on your trading layout. It happens when the price and the indicator disagree about momentum:
- Bearish divergence: Price makes a higher high, but RSI makes a lower high. The bulls pushed the price up, but with less force than the previous pump. Exhaustion is setting in.
- Bullish divergence: Price makes a lower low, but RSI makes a higher low. The sellers are dumping, but the momentum is drying up.
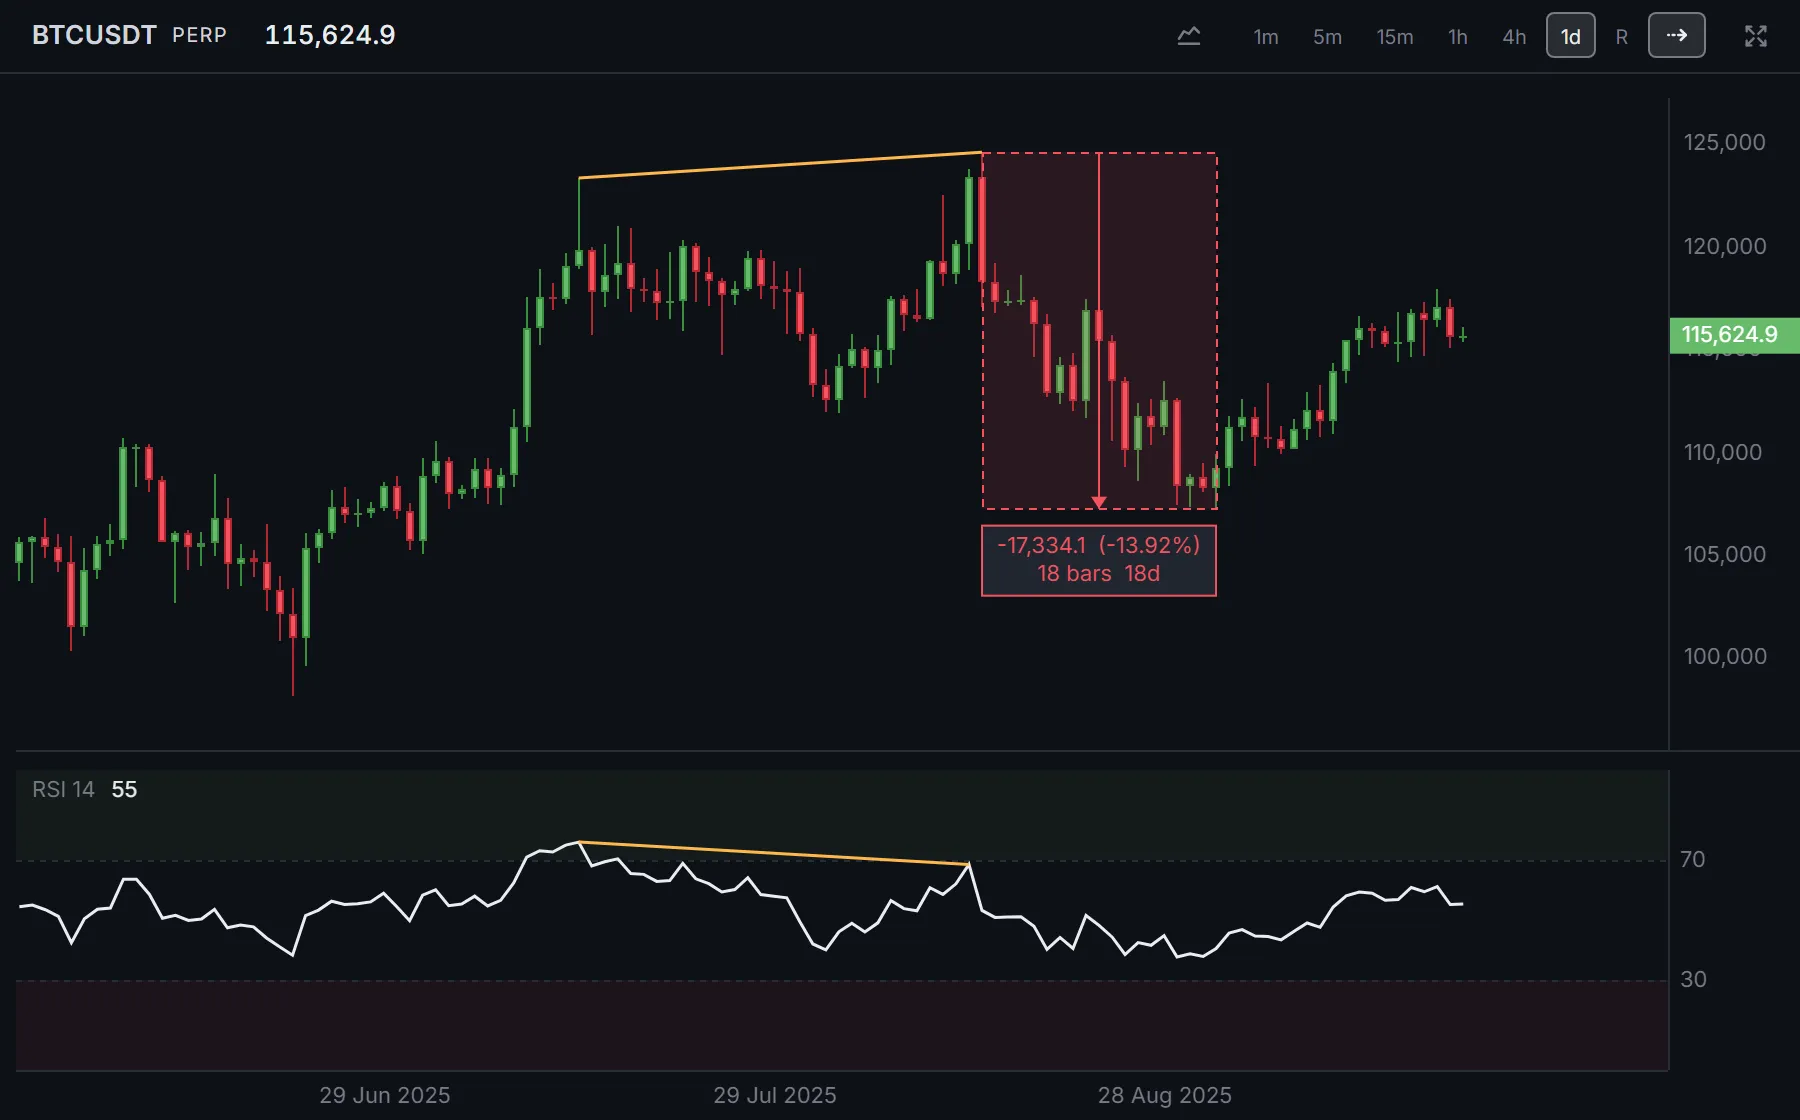
The summer of 2025 produced a textbook bearish divergence. On July 14, BTC hit $123,300 with an RSI of 76.0. A month later, it pushed to a new all-time high of $124,546. However, the RSI peaked at just 68.5.
| July High | August High | |
|---|---|---|
| Date | 14 July 2025 | 13 and 14 August 2025 |
| Price | $123,300 | $124,546 |
| RSI Peak | 76.0 | 68.5 |
The momentum was fake. By September 1, the price bled down to $107,212 (a 13.9% drop).
When Divergence Fails
A failed divergence is where undisciplined traders get chopped up.
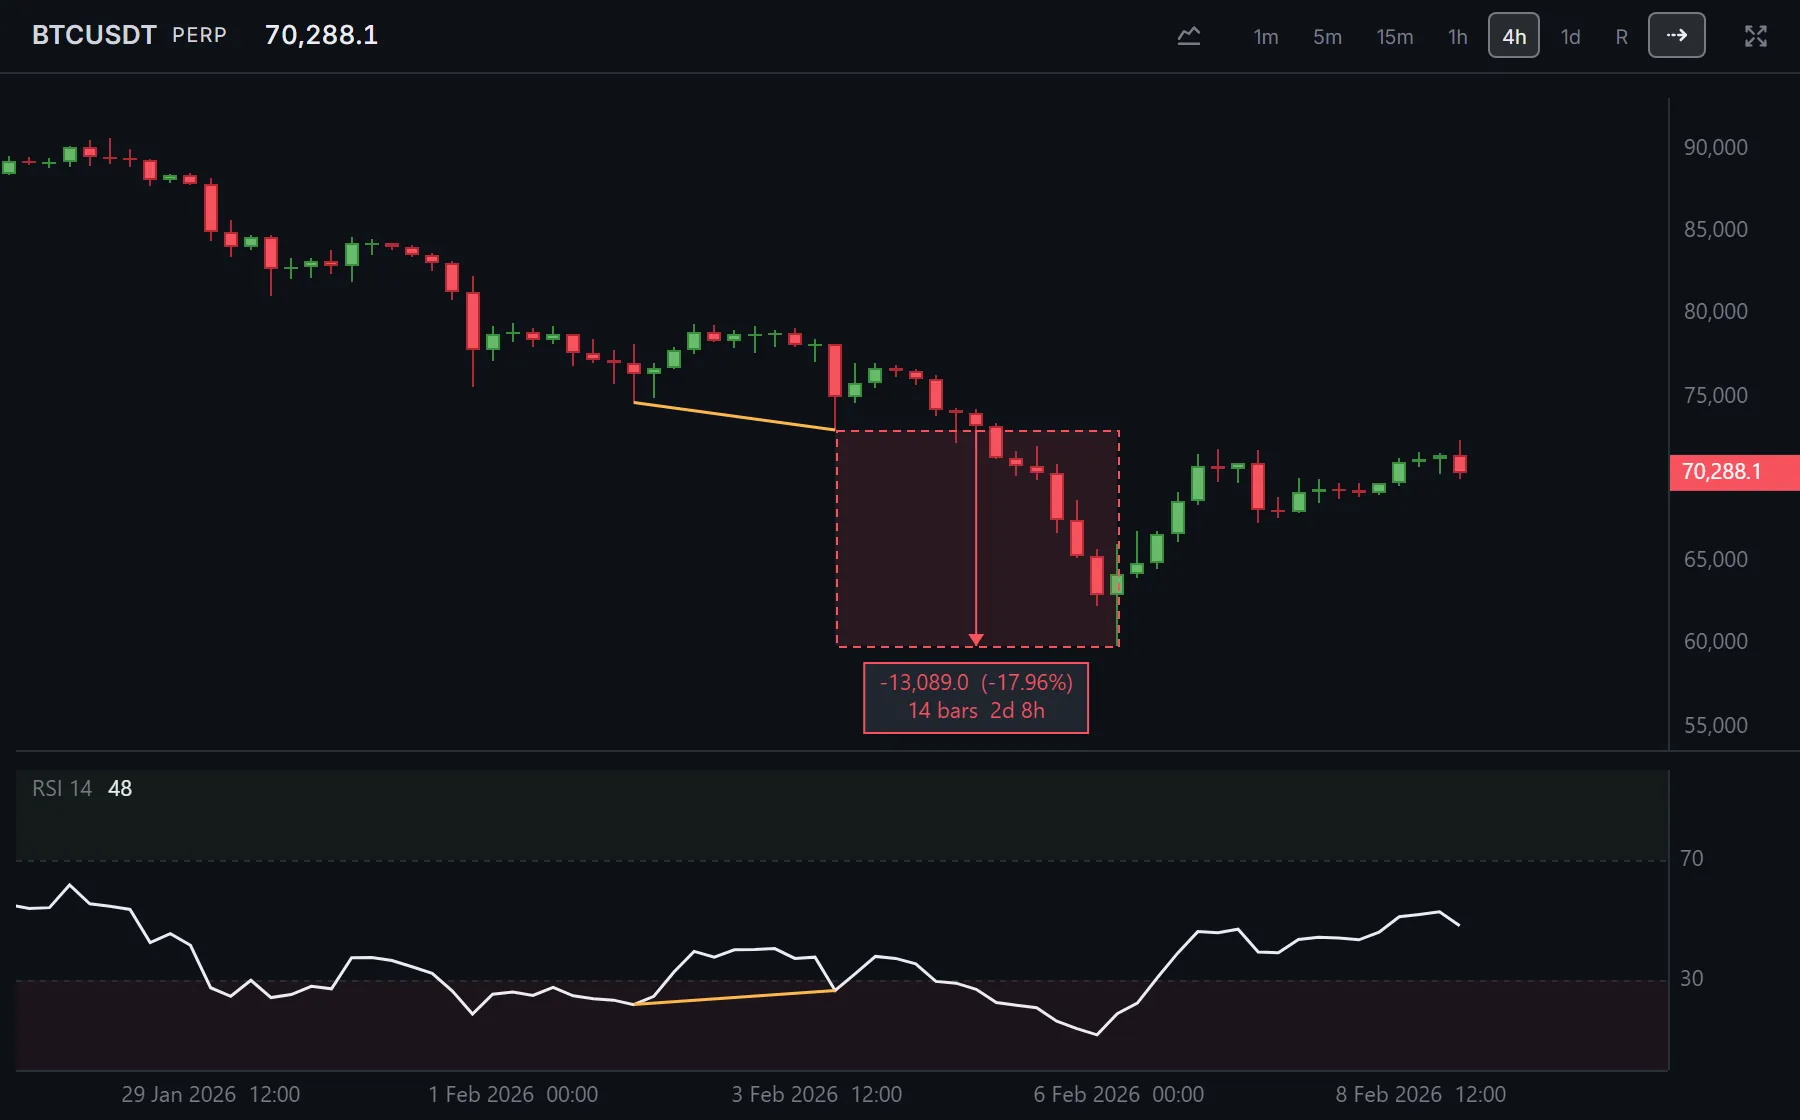
In a heavy trend, RSI can form three or four divergences in a row while the price just keeps going. A divergence is a condition to watch for, not an immediate signal to hit the buy or sell button.
How to Trade It Like a Pro
To survive trading divergences, you need two things: confirmation and a hard stop.
- Confirmation: Wait for the price to actually agree with the RSI. For a bullish divergence, wait for a candle to close above the local lower high. It costs you the exact bottom, but saves you from catching falling knives.
- The hard stop: If you long a bullish divergence, your stop goes just below the second low. If the price wicks below it, the pattern is dead. Take the small loss and move on.
Executing Divergences Without Lag: Enter Awansi
Timing a divergence entry requires precision. If you spot a bullish divergence on a 15 minute TradingView chart, but then have to switch tabs, log into your exchange, and deal with a clunky, lagging UI to place your order, the entry price is already gone.
This is exactly why we built Awansi.
Awansi allows you to customize your trading layout, overlay your RSI and technical indicators exactly how you want them, and execute directly from the chart via your exchange API (like Binance or Hyperliquid). Zero tab fatigue, sub-second execution, and no missed entries when the divergence finally confirms.
Trade directly from your charts with Awansi Beta. Try it free.
Key Takeaways
- Don’t blindly short 70 or buy 30. Overbought simply means the trend is incredibly strong.
- Divergence is the real signal: Look for price making new extremes while momentum fails to follow.
- Never trade without a stop: Divergences can and will fail in strong trends.
- Execution speed matters: Don’t let exchange lag ruin a perfectly timed technical setup.